Reflections on the network impact due to COVID-19
- 7 minsDuring these very unusual days marked by the COVID-19 outbreak, the Internet traffic has seen an unprecedent volume increase. This can be observed in the different IXP statistics which are quite interesting
First of all, What is an IXP?
IXP stands for Internet Exchange Point which is a neutral point where different providers (ISPs) and CDNs (Akamai, Amazon CloudFront, Cloudflare, etc) exchange traffic. In summary, a very large switch where different organizations interconnect each other helping to reach other networks and also speeding up the latency towards CDNs so services like Netflix, YouTube, Spotify, etc. work as fast as they usually do.
Traffic trends during the COVID-19 outbreak
The previously mentioned IXPs usually have public statistics of their aggregated (this is bundled uplink and downlink) traffic volume using tools such as cacti. Depending on the IXP we can find to a certain extent a detailed statistics of their traffic in the last days, weeks, months, etc.
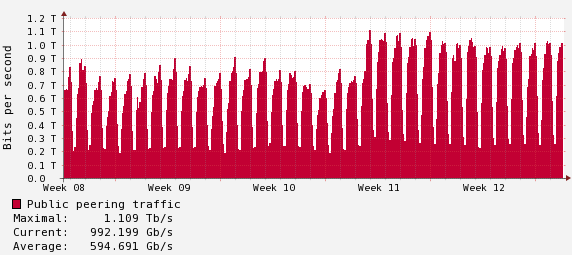
Italy
In the Milan IXP we can observe a drastic peak on week 11, coinciding with the national lockdown imposed by the authorities on the 9th of March. We can observe how the maximum peaks before the lockdown reached around 900 Gbps, while after the lockdown it raised to a peak of 1.1 Tbps.
In the following graph we can observe how the overall average moved from an approximate of 550 Gbps to nearly 700 Gbps, so approximately a 30% raise in just a week.
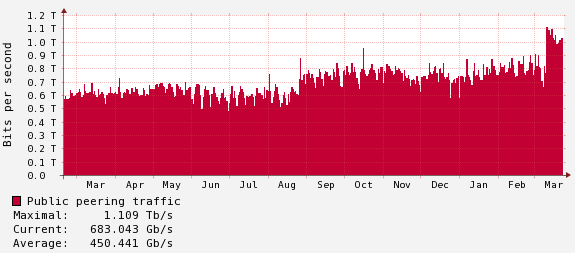
This pattern goes aligned to what some CDNs such as Cloudflare has observed on their networks.
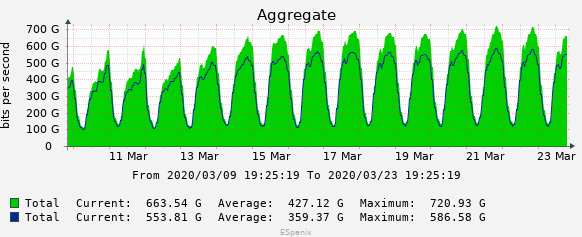
Spain
In Madrid’s IXP ESPanix, the lockdown started during the weekend of the 14th and 15th of March and we can see how also traffic increased from a maximum peak of roughly 600 Gbps to 700 Gbps and later on on the 21st of March 720 Gbps.
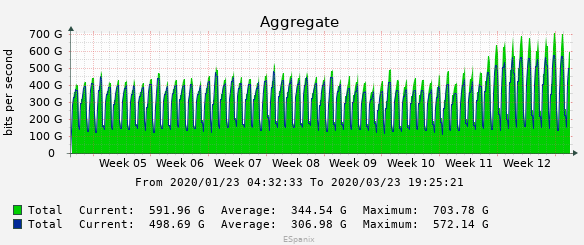
This traffic increase can be better observed in the following weekly graph that shows how approximately we have moved from an average volume of 320 Gpbs to around 450 Gbps if we look in the last days average. THis increase is around of 35-40% which is also aligned with the Italian case as both countries have suffered similar restrictions.
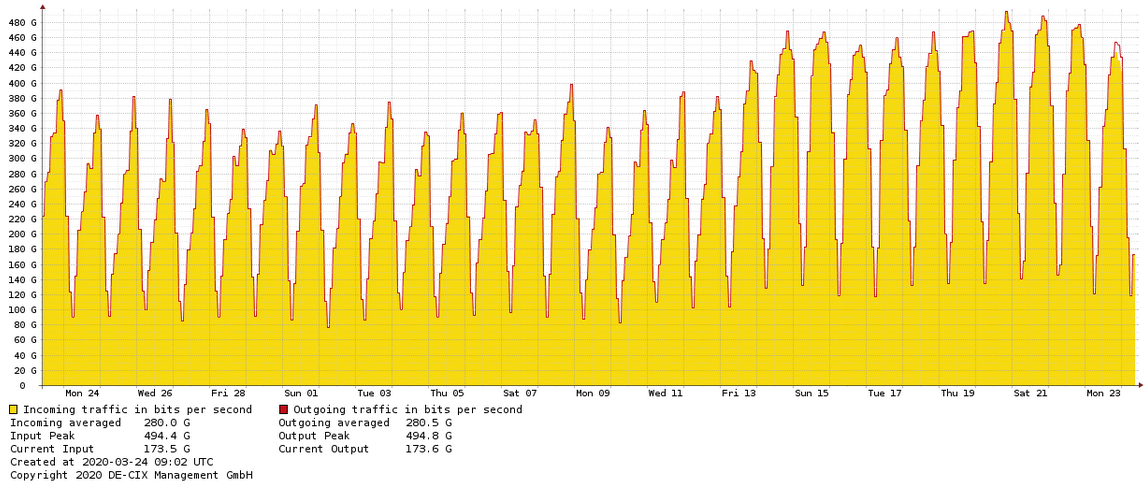
Following the same pattern, another IXP in Spain, DE-CIX has experienced a traffic growth similar to ESPanix moving from maximum peaks of around 360 Gbps to peaks of 494 Gbps
Germany
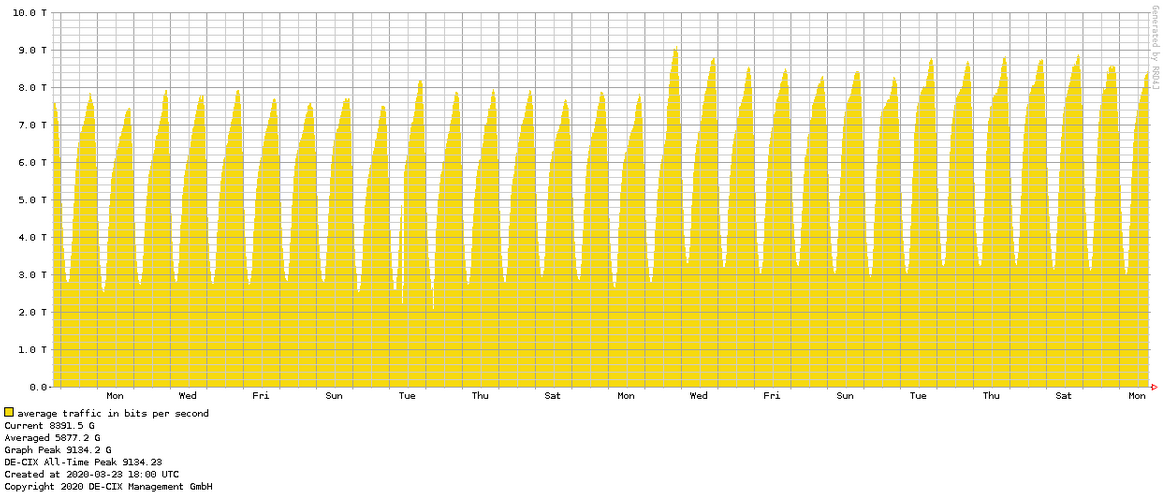
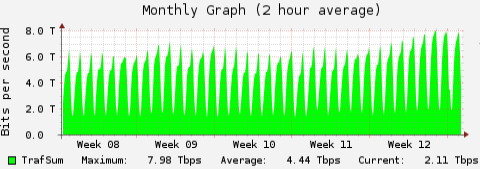
Frankfurt hosts one of the biggest IXPs in Europe and globally where many other IXPs interconnect, thus it is remarkable to mention the statistics in here. We have seen how in the last year the traffic average was of around 5.6 Tbps and now in the last two days it scaled up to 6.3 Tbps, which represents approximately a 10% increase. Also worth to mention an incredible peak on the 17th of March of 9.1 Tbps, which has been the highest peak on this IXP history.
More info:
https://www.de-cix.net/en/news-events/news/big-upswing-in-internet-usage-due-to-covid-19-measures
https://www.de-cix.net/en/news-events/news/de-cix-frankfurt-reaches-9-1-tbps
Finland
Even in smaller European countries we can observe the growth in traffic as most people are now working from home, with kids at home and this resulted in an overall larger bandwith demand.
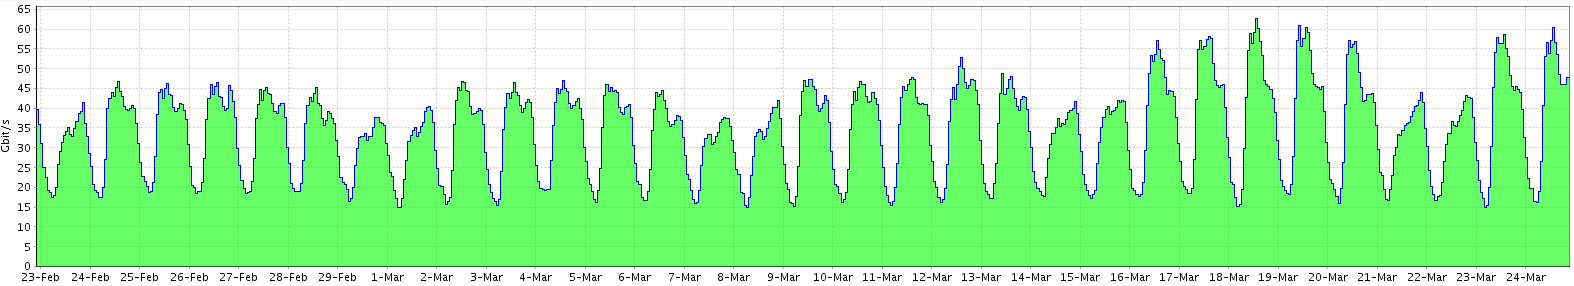
We can take the data from the Finnish FICIX IXP and we can also observe a significant growth during the week of the 16th to 22nd of March as most people was sent home. As in the average FICIX went from an average of around 33 Gbps to 37 Gbps, which gives an approximate of 12% increase. In terms of peaks, the maximum peak before the outbreak was of approximately 48 Gbps when the highest peak since the 16th of March has been of 62.8 Gbps on the 18th of March.
 Click here to see larger graphic
Brazil
On the other side of the Atlantic similar behaviours have been observed. For instance at the IX-BR in Brazil, we can see a significant increase in the traffic volume from the 19th of March as more measures were taken by the goverment.
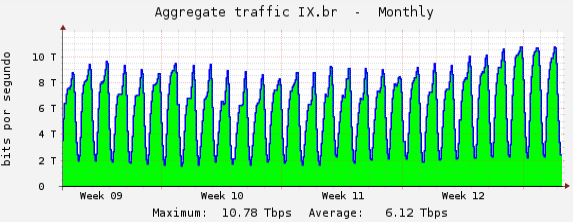
We can also look at the statistics at São Paolo were the most restrictive measures have been taken and how this affected on the traffic increase moving from an average of approximately 4.40 Gbps to 5.7 Gbps.
Mobile networks impact
Unfortunately mobile operators usually do not share this type of data as they consider it commercially strategic information. There is not an unanimous message on this topic as some claim that mobile broadband has decreased in favor of fixed (WiFi) while other regions and ISPs claim mobile broadband has increased. This may be linked to the different trends in each country as some customers may be tethering while others rely more on fixed broadband access. In any case some data has been published by several providers and users around the internet showing how mobile network patterns have changed in the last days.
- In Spain, a joint message was released by all Spanish ISPs saying that fixed access has increased around 40% (similar to the observed at the IXPs) while mobile broadband increased around 25%. Also a remarkable increase of 50% in voice calls was observed.
- In line with the previous, the European Union asked content providers Netflix, Amazon, YouTube, etc to reduce the default streaming quality in order to reduce the data volume generated.
- British Telecom: We’re seeing a 5% decrease in mobile data traffic … Roaming traffic is falling by about 10% per day, with a 55% drop over the last 5 days. We are seeing an increase in mobile voice call volumes.
- In Asia and especially in China, most of the operators had network freezes with only inverventions to expand the network in order to cope with the huge traffic increase.
- In Australia Telstra has given away 25GB of data to their mobile subscribers plus other measures. Similar measures were implemented by Vodafone Australia and other operators.
Thoughts on IXPs data and other conclusions
While digging into these graphs I thought of other funny interpretations of this data such as “What time do people go for lunch in this or that country?”. We can see this in the daily graphics. For example, myself having lived in both Spain and Finland, I was able to clearly see the difference in the graphs between both countries related to the time of the day people move away from the keyboard (and generate less data) to fill their stomachs:
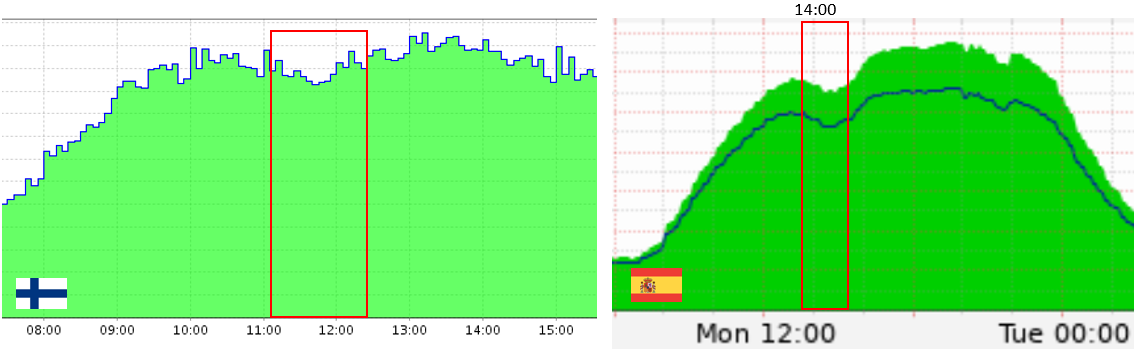
In this graph on the left we can see how Finns start leaving their seats at around 11:15 and by 12:30 most of them are back. On the right side, we can observe how Spanish people start leaving their seats at around 13:45 and most people are back at around 15:15. That is certainly aligned to the times people go for lunch if you have experienced both countries.
Even though this is something that may look obvious, we can observe how the Internet and connectivity has become now an indispensable part of our lives and how events such as COVID-19 outbreak is having also an impact on our usage. Also is worth to mention that many telecom operators and ISPs have relaxed some of their data and voice packages due to the ongoing outbreak which shows the importance of these entities in society nowadays. Also highlights the need to have of proper mechanisms to enforce such measures in a network in very little time as many critical aspects of our life rely on mobile and fixed network access now.
References and sources
All the graphs exposed here are public and gathered from the following websites:
DE-CIX Frankfurt: https://www.de-cix.net/en/locations/germany/frankfurt/statistics
MAD-IX Madrid: http://stats.espanix.net/#
MIX-IT Milan: https://www.mix-it.net/statistiche/
FICIX Aggregated: https://stats-ficix.basen.com
IX-BR Brasil Aggregated: https://ix.br/agregado/

Alberto
A world-wanderer having fun